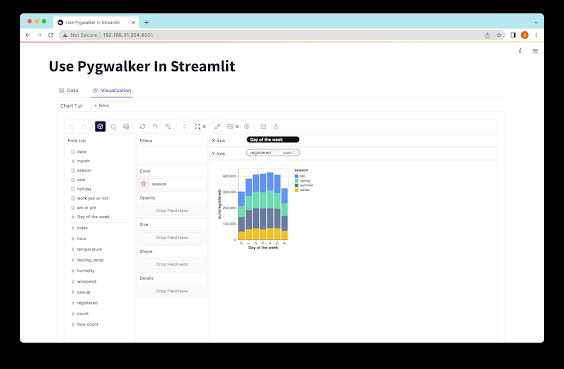
Step-by-Step Guide to Make a Bar Chart
The world of data visualization is vast and complex, with multiple tools and techniques to present information in a meaningful and informative manner. One of the most widely used data visualization techniques is the bar chart. In this article, we'll take a closer look at what bar charts are, how they work, and how to create one using various tools.
What is a Bar Chart?
A bar chart is a graphical representation of data in which bars of equal width are drawn horizontally or vertically, with the height or length of each bar proportional to the value of the data it represents. Bar charts are commonly used to display categorical or discrete data, typically with numerical values on one axis and categories on the other. This type of chart is especially effective at highlighting differences between data points or categories and can be used to compare values or show trends over time.
The Anatomy of a Bar Chart
To create a bar chart, you need to first decide which type of chart is best suited for the data you want to present. Bar charts can be either vertical or horizontal, depending on the orientation of the data. A vertical bar chart is typically used when the data is presented along the x-axis, while a horizontal bar chart is used when the data is presented along the y-axis.
Once you've decided on the orientation of your bar chart, you need to label the axes properly. The x-axis represents the categories or discrete data, while the y-axis represents the values. You should also include a title for the chart to help your audience understand what the chart is presenting.
Creating a Bar Chart
There are multiple ways to create a bar chart, depending on the tool you're using. Some popular tools for creating bar charts include Microsoft Excel, Google Sheets, and online data visualization software like Tableau or Plotly. In this section, we'll walk you through how to create a bar chart using Microsoft Excel.
Creating a Bar Chart in Microsoft Excel
1. Open Excel and enter your data into the spreadsheet.
2. Highlight the data you want to include in your bar chart. Make sure to include column headers.
3. Click on the "Insert" tab and select "Bar" from the chart options.
4. Choose the type of chart you want to create. If you're creating a vertical bar chart, select the "Clustered Column" option. If you're creating a horizontal bar chart, select the "Clustered Bar" option.
5. Your bar chart should now be visible in the spreadsheet. To customize the chart, you can change the colors, add labels, or adjust the axis values.
Creating a Bar Chart in Google Sheets
1. Open Google Sheets and enter your data into the spreadsheet.
2. Highlight the data you want to include in your bar chart. Make sure to include column headers.
3. Click on the "Insert" tab and select "Chart" from the menu.
4. Choose the type of chart you want to create. If you're creating a vertical bar chart, select the "Column" option. If you're creating a horizontal bar chart, select the "Bar" option.
5. Your bar chart should now be visible in the spreadsheet. To customize the chart, you can change the colors, add labels, or adjust the axis values.
Creating a Bar Chart with Tableau
1. Open Tableau and connect to the data source you want to use.
2. Drag and drop the data columns you want to include in your bar chart onto the "Columns" and "Rows" shelves.
3. Click on the "Show Me" tab and select the "Bar" option.
4. Your bar chart should now be visible in the worksheet. To customize the chart, you can change the colors, add labels, or adjust the axis values.
Conclusion
Bar charts are a simple yet effective way to present data in a visually appealing and informative manner. They are commonly used in various fields, including statistics, business, and healthcare. With the right tools and techniques, you can create a professional-looking bar chart that effectively communicates your data to your audience. To learn more about creating and using bar charts, check out the resources available to make a bar chart.

Comments
Post a Comment